Green A Producer via Green Technology
Upholding the green philosophy that we only have one Earth, Nanya insists on leaving the best environment to every future generation. We actively manage all environmental impacts of our operations and adopt higher standards than required by law for energy, operations, and adopt higher standards than required by law for energy, resources, emissions, and waste to avoid or mitigate the risk of impacts. We also research and develop advanced and highly efficient products to assist consumers in lowering energy consumption and reducing carbon emissions when using products. We have set goals for our sustainability performance to fulfill our responsibility of cleaner production and to protect the natural environment. As climate change has become one of the most significant global risks, we implemented risk identification, assessment and management in accordance with the Task Force on Climate-related Financial Disclosures (TCFD) Recommendations to enhance our operational resilience under the climate change crisis.

-
Scope 1 & 2 reduction of 12.9%
Scope 3 reduction of 19.4% Better than SBT Target - The reduction rate of perfluorocarbon (PFC) emissions during industrial processes 93 %
- Cumulative energy saved with energy conservation measures from 2017 to 2024 74,078 MWh
Strategy and Performance of Material Topics
 Nature and Climate Management

Nanya Technology acknowledges the dependencies and risks that our operations (production site: Nanlin Technology Park) and value chain pose to nature and climate. In 2023, we became an early adopter of the Task Force on Nature-related Financial Disclosures (TNFD). Following the TNFD and the Task Force on Climate-related Financial Disclosures (TCFD) recommendation guidelines, we announced a biodiversity policy and established a robust LEAP operational mechanism to assess nature- and climate-related dependencies and risks across our operations, upstream suppliers, and downstream customers. We also formulated response strategies and actions, set management targets and indicators, and aim to mitigate impacts of risks.
Nanya Technology TNCFD Framework
- Governance
- Strategy
- Risk Management
- Indicators and Targets
-
Governance
Management Strategies and Actions
- At the Board of Directors' governance level, nature and climate are listed as Board of Directors topics, and a Sustainable Development Committee was established to implement relevant management practices.
- At the executive level, management participates in quarterly sustainable management and risk management meetings to review performance and resolve action items. A cross-departmental Sustainability and Risk Management Division under the President Office is responsible for coordination.
- Efforts are underway to strengthen governance capabilities on nature and climate among the Board of Directors, management, and all employees.
2024 Implementation Status- In 2024, 6 Board of Directors meetings and 2 Sustainable Development Committee meetings were held to review topics such as the Sustainability Report, the TNCFD Report, greenhouse gas emissions, carbon fees and self-determined reduction plans, IFRS Sustainability Disclosure Standards implementation, and sustainability rating performance.
- Each year, the Risk Management Steering Center evaluates the identified material nature- and climate-related risks. In 2024, response measures were implemented for 164 risks based on their risk levels, and the risks are continuously monitored.
- In 2024, Board members completed 96 hours of training, with courses covering a diverse range of topics such as ESG governance, economics, corporate governance, sustainable finance, green finance, climate change, TNFD, AI, and legal compliance.
-
Strategy
Management Strategies and ActionsResilience and adaptation:
- Conducting biodiversity sensitivity analysis of operational sites.
- Identifying nature- and climate-related dependencies and impacts of operations.
- Assessing nature- and climate-related management across the value chain.
- R&D of low-carbon products, production via green technology, sustainable supply chain management, and development in harmony with nature reduce Nanya Technology's impact on nature and the climate effectively.
- Gathering and consolidating feedback from external stakeholders through various platforms.
- Organizing nature- and climate-related events to communicate Nanya Technology's sustainability principles to relevant stakeholders.
2024 Implementation StatusResilience and adaptation:- Making use of geographic information systems and publicly available government data and assessing whether Nanya Technology's operational sites fall within a 2-kilometer radius of biodiversity-sensitive areas.
- Gathering stakeholder concerns on nature- and climate-related issues, and holding cross-departmental workshops to identify short-, medium-, and long-term risks and opportunities. In total, 14 high-dependency factors and 9 material impact factors were identified.
- Simulating nature- and climate-related risk scenarios to assess their impacts on operations, strategy, and financial planning. (1) Transition scenarios: National decarbonization pathways (NDC), IEA WEO net-zero pathways (APS, NZE);(2) Physical scenarios: AR5 RCP2.6, 4.5, 6.0, and 8.5.
- 50 questionnaires were distributed to key suppliers. The analysis identified 2 high-risk, high-exposure dependency factors and 5 factors of high concern to suppliers.
- Considering the risks and opportunities associated with various climate transition and physical scenarios, as well as the characteristics of Nanya Technology's operations, strategies have been formulated around green product R&D, green manufacturing, adaptation enhancement, and collaboration with sustainability partners.
- Conducting annual ecological monitoring and restoration efforts to minimize the impact on critical local areas during operational expansion. We also plan to continue with ecological restoration as a form of environmental compensation.
- Actively participating in industry associations to jointly lead nature- and climate-related initiatives and sharing Nanya Technology's practical experiences.
- We collaborate with local organizations to coordinate environmental education, environmental protection initiatives, and cultural preservation events that strengthen ties with the local community. Since 2023, we have actively explored possible environmental compensation measures, and will work to protect and restore natural habitats near operational sites to help foster a better community environment.
-
Risk Management
Management Strategies and Actions
- In line with the Company's Risk Management Procedure, we assess the materiality of risks and opportunities arising from various scenarios related to natural factors and climate change. Relevant response plans are formulated, integrated into the Enterprise Risk Management (ERM) framework, and regularly confirmed by senior management. A comprehensive contingency plan was formulated for nature- and climate-related risks.
- Carbon fee forecast: The Ministry of Environment announced the fee-charging rates of carbon fees in 2024. The carbon fee program took effect as of January 1, 2025, with collection of fees beginning in 2026.
- GHG emissions for Scopes 1, 2, and 3 are inventoried and verified annually to identify emission sources and prioritize management efforts.
- Promoting product life cycle assessments and addressing emission hotspots.
2024 Implementation Status- Key risks identified are primarily transition risks, including changes in the national energy structure, customer demand for low-carbon products, and the impact of fulfilling SBT commitments. These three mid-term risks are estimated to have a financial impact equivalent to approximately 3-4% of the Company's annual revenue.
- Pertaining to the collection of carbon fees in 2026, if carbon fees are calculated at NT$300/tCO2e, the estimated payment would be NT$145 million; at NT$100/tCO2, the estimated payment would be NT$40 million—equivalent to 0.5%-1.6% of annual revenue.
- Major opportunities identified include product technology and new market development. As the net-zero trend continues, smart clean energy technologies are expected to drive growth in DRAM demand. According to IEA scenario analysis, the clean technology market is projected to triple by 2030. The Company will seize this opportunity by continuing to invest in innovative R&D resources, which accounted for 22.5% of total revenue in 2024.
- The WRI Aqueduct Tool was used to assess the Company's short- and long-term (2050) water stress levels, which were found to be medium-to-low risk (10-20%), indicating that it is not located in a water-stressed region. According to Taiwan Climate Change Projection Information and Adaptation Knowledge Platform (TCCIP)'s Climate Change Water Hazard Map, the Company will not face the risk of water scarcity under the RCP 8.5 scenario in the middle of this century (2036-2065). Since the introduction of water conservation charges in 2023, our efforts in water conservation and reclamation have qualified Nanya Technology for the lowest rate, which limits the annual water cost increase to only about 3% with minimal impact on operational costs.
- GHG emissions in 2024 will be fully inventoried and verified by May 2025. A 100% product environmental footprint inventory has been completed. Management plan improvements have been launched for the top three carbon footprint hotspots identified in 2024.
-
Indicators and Targets
Management Strategies and ActionsEmission risk:
- Scope 1: Uncertainty in the development of new abatement technologies may reduce the removal efficiency of fluorinated process gases. This could lead to tighter air pollution control and emissions standards in the semiconductor industry, and increase VOCs treatment costs.
- Scope 2: Growing electricity demand will raise the share of renewable energy and carbon fee expenses, and increase operational costs.
- Scope 3: The main emission sources come from goods and services purchased in the upstream value chain, which increases supplier management costs.
- Conducting annual inventory and verification for Scope 1, 2, and 3 GHG emissions.
- Setting GHG management and energy/resource recycling targets.
- SBT reduction target: 25% reduction of Scope 1+2 GHG emissions by 2030 compared to the 2020 baseline (469,744 tCO₂e,100% coverage), and 27% reduction of Scope 3 product unit emissions by 2030 compared to the 2020 baseline (1,151,865 tCO₂e,100% coverage).
- Enhancing the Company's drought resilience and increasing water reclamation rates.
- Promoting certifications for green and smart factories.
- Participating in CDP's climate change and water security projects, disclosing related information, and engaging with stakeholders.
2024 Implementation StatusMitigation indicators:- The 2024 inventory and verification of Scope 1, 2, and 3 GHG emissions was completed and covered 100% of revenue.
- 2024 market-based GHG emissions: 409,000 tons; unit emissions: 416 kg per 4Gb kpcs—a 1% reduction from 2020.
- 20 raw material usage proposals were completed via the Kaizen Proposal System in 2024.
- NT$36.17 million was invested in 2024 to complete 27 energy conservation programs, achieving 5,513 MWh of energy savings, 2,613 tCO2e of carbon reductions, and NT$16 million in electricity cost savings.
- Renewable energy strategy: 35.23 million kWh of renewable energy was used in 2024, accounting for 4.4% of total electricity consumption.
- A self-determined carbon fee reduction plan is scheduled for submission to the Ministry of Environment in June 2025. The plan is in line with benchmark reduction rates, and the need to increase renewable energy procurement was determined after assessment.
- 2024 SBT implementation results: Scope 1+2 emissions reduced by 12.9%; Scope 3 emissions reduced by 19.4%.
- Volume of reclaimed and reused water in 2024 totaled 5.59 million cubic meters.
- Achieved Alliance for Water Stewardship (AWS) Platinum Certification in 2023.
- Included in CDP's Climate Change A List, Water Security A- in 2024.
Greenhouse Gas Inventory
The Company conducts its GHG inventory with reference to ISO 14064-1, Ministry of Environment's Climate Change Response Act, Regulations for the Management of the Inventory, Registration, and Verification of Greenhouse Gas Emissions, Greenhouse Gas Emissions Inventory Guidelines, and the WBCSD/WRI GHG Protocol. Organizational boundaries are defined using the 100% operational control approach. At present, all Scope 1, Scope 2, and Scope 3 GHG emissions are verified by SGS, a third-party certification institution, in accordance with international standards.
-
 GHG emissions in 2024
GHG emissions in 2024 totaled 409,138 metric tons CO2e ,the main sources of emissions were purchased electricity.
-
 Scope 3 GHG emissions categories in 2024
Among all Scope 3 GHG emissions categories, the highest GHG emissions came from the use of sold products, followed by purchased goods and services, and subsequently fuel- and energy-related activities not included in Scope 1 or 2.
Percentages of 2024 Scope 1 and Scope 2 Emissions by Category
- Scope 1 and Scope 2
- Scope 3
-
Scope 1 and Scope 2

-
Scope 3


Greenhouse Gas Reduction
The Company actively promotes voluntary emission reductions and participates in the annual voluntary GHG reduction program launched by the Industrial Development Administration, Ministry of Economic Affairs. Given the high global warming potential (GWP) of perfluorocarbons (PFCs), we have implemented phased GHG reduction plans since 2006. During facility planning, we procured high-efficiency local scrubbers. Currently, the thin-film and etching areas use burn-type PFC local scrubbers, which use high temperatures from combustion to destroy PFCs. To reduce fugitive PFC emissions, Nanya Technology established local scrubber acceptance criteria for PFC reduction rates: CF4 gas treatment efficiency must exceed 90%, reduction rates of C3F8, C4F6, C4F8, CHF3, CH2F2, and SF6 must exceed 95%, and NF3 reduction must exceed 99%. After installation, all local scrubbers undergo PFC abatement verification using FTIR to align with future reduction trends.
- 2024 Scope 1+2 GHG emissions was reduced by 12.9 % compared to 2020 12.9 %
-
Lower GHG emissions in the production process
Carbon-reduced
Manufacturing -
25% reduction in Scope 1 & 2 GHG emissions
27% reduction in Scope 3 GHG emissions per unit produced (Base year: 2020) 2030 SBT Reduction Target

 Energy Resource Management
Energy Structure
The environmental impact and finite availability of fossil fuels have become critical concerns, making effective energy management an urgent priority. Nanya Technology primarily uses purchased electricity, steam, and natural gas, and does not generate energy in-house. Indirect energy use which results in GHG emissions includes raw material transportation within facilities, raw material suppliers' production activities, waste transportation/treatment, employee business travel, and commuting.
Nanya Technology has developed an Energy Review Management Procedure to effectively manage its energy use and consumption. This procedure allows the Company to assess conditions of energy use and consumption, identify major energy-consuming operations and energy-saving opportunities, establish controls, and set measurable improvement targets to achieve energy conservation benefits.
- Energy Structure
- Electricity Consumption from 2020 to 2023
-
Energy Structure

-
Electricity Consumption from 2020 to 2023

Renewable Energy and Usage Planning
In terms of renewable energy usage, Nanya Technology implements planning and execution in the following three key phases.

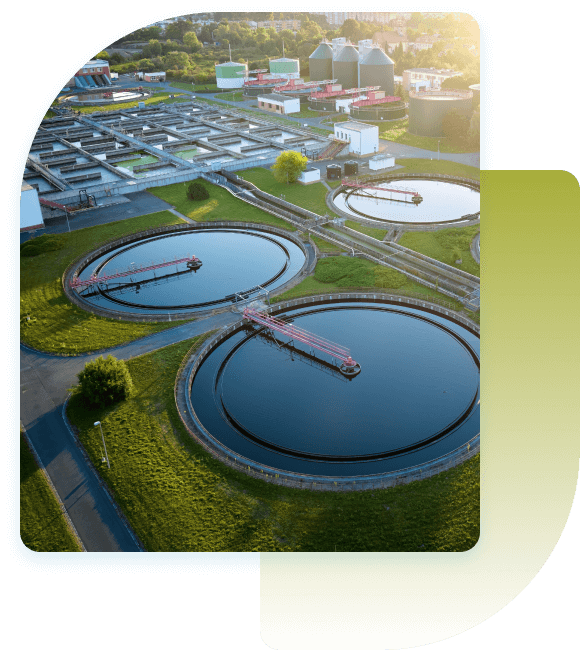
 Water Resource Management

Due to global climate change, rainfall in different regions of Taiwan has become increasingly polarized, resulting in both flooding and water shortages occurring simultaneously. Therefore, as a key member of the semiconductor industry, Nanya Technology has long been attuned to the water scarcity risks brought about by global climate change and deeply understands the impact that climate change and water can have on operations. To mitigate its environmental impact and the risks associated with water shortages, Nanya Technology continues to advance water conservation initiatives and is further committed to water reclamation and reuse. In 2023, the Company adopted the Alliance for Water Stewardship Standard (AWS), and was awarded AWS's highest certification level, Platinum, following its 2023 assessment. From the source of every drop of water to its use and final discharge, Nanya Technology practices pragmatic and effective water management to protect the ecosystem. Cherishing every drop of water, we continue to improve water usage efficiency while actively aligning with the international AWS standards and implementing the Five Outcomes to achieve sustainable water management in a systematic and ongoing manner.
Nanya Technology's efforts in water resource management have been recognized by international environmental evaluation bodies. From 2022 to 2023, the Company received an "A" leadership rating in the CDP Water Security category for two consecutive years. From 2022 to 2024, we also received the Taiwan Corporate Sustainability Award's Water Resource Management Leadership Award for three consecutive years. In 2024, the Company was awarded Platinum-level certification by the Alliance for Water Stewardship Standard, affirming its commitment to tackling climate change and water resource management while contributing to global sustainability goals.
- 2022-2023 CDP Water Security Leadership Level A
- 2022-2024 TCSA Water Resource Management Leadership Award
- Alliance for Water Stewardship Platinum Certification
Nanya Technology's Water Management Policy
Nanya Technology's water resource management policies and requirements apply to all operational, R&D, and manufacturing sites. Matters related to water usage, conservation, and risk assessments are compiled annually and reported to the Board of Directors for review.

Water Resource Risk Management
Nanya Technology continues to strengthen its water management system and expand its water recycling capacity. The Company has established a robust contingency plan to mitigate the immediate impacts of short-term drought. The facility has a 43-million-liter water reservoir, a 0.5-million-liter detention basin for effective rainwater reclamation during the rainy season (temporarily suspended during FAB 5A construction), and seven wells. Nanya Technology also formed an emergency response organization for water shortages with neighboring plants of Formosa Plastics Group for mutual water-sharing support. Improvement work has been completed at the Shimen Reservoir watershed. The risk of service disruption due to turbidity from heavy rainfall has decreased. The Company can handle raw water turbidity up to 10,000 NTU, enabling it to manage most conditions. In terms of water reclamation and reuse, the effective treatment of acidic/alkaline wastewater, hydrofluoric wastewater, and organic wastewater using dedicated reclamation equipment led to the total volume of reclaimed water reaching 5,590 million liters in 2024. Through internal adaptation capacity and water recycling systems, Nanya Technology can operate for up to 21 days without an external water supply. As of now, there have been no production losses due to water shortages.
Nanya Technology continues to improve standard procedures and processes. It assesses water-related risks through its environmental and operational risk management frameworks, promotes related improvement measures, and formulates contingency plans. These are regularly reviewed by the Sustainable Development Steering Center and the Risk Management Steering Center at quarterly meetings. Moving forward, Nanya Technology will continue to enhance our capacity for water use and management. Newly constructed plants will include water regeneration centers, storage reservoirs, and backup water sources to address the uncertainties of climate change.
 Raw Material Reduction and Reuse
Raw Material Reduction
Nanya Technology regularly reviews the rationality and appropriateness of raw material usage in production, and simplifies manufacturing processes to reduce material consumption. The Company's designated team sets annual raw material reduction targets and regularly reviews overall performance in raw material reduction. In 2024, a total of 20 proposals for raw material usage improvements were completed via the Kaizen Proposal System, including the development of new processes and formulas as well as reducing process duration to reduce consumption. Among the 2024 improvement proposals, process parameter optimization and volume reduction improved slurry usage efficiency in the CMP area, achieving a maximum annual reduction of 135.4 metric tons in consumption.

Recycling and reuse

Waste Reduction Technology
Copper Waste Liquid Electrolytic Regeneration System
Nanya Technology invested NT$8.19 million to build an electrolytic regeneration system for copper waste liquids. After resin adsorption and regeneration, the system produces high-concentration copper sulfate waste liquid, which is then electrolyzed to recover copper foil. Through the Copper Together project, the Company collaborated with Ming Chi University of Technology and New Taipei City-based artist Ching-Tai Chuang to turn recycled copper foil into artwork, enhancing engagement with stakeholders. The copper foil is also reused as industrial-grade raw material, achieving the benefits of resource circularity. In 2024, a total of 1,070 kilograms of copper foil was produced.

-
 What Can We Use "Copper Foil" For?
Engaging with our team members to build sustainability part of work culture
-
 What Does "Copper Foil" Come From?
A short film to share the ideas of recycling scrap copper foil for other purpose
-
 Circular Economy
Nanya put a lot of effort in creating circular economy, invest in process water recycle system and fulfill the target to resourcelize the waste of the fab
-
 Ways to Recycle Scrap Copper
Recording the process of turning scrap copper into numerous uses so that more people can embrace the ESG thinking in their daily lives
 Environmental Pollution Prevention
In alignment with our commitment to environmental protection and environmental impact assessments, Nanya Technology regularly monitors key environmental impact factors within our development sites, such as air quality, noise and vibration, surface and underground water quality, traffic flow, as well as the ecosystem for animals and plants. Since 2014, there have been no recorded violations of environmental regulations. Nanya Technology also collaborates with regulatory authorities to confirm that our development sites are not located in environmentally sensitive or areas with designated purposes. Through its environmental, safety, and health policies, the Company is fully committed to waste reduction and resource reuse initiatives to meet legal requirements and fulfill environmental protection commitments.
Air Pollution Control
Since the establishment of its facilities, Nanya Technology has placed great emphasis on pollution prevention. In addition to implementing environmental management programs to effectively reduce raw material consumption and lower the concentration of exhaust emissions, Nanya Technology uses air pollution control equipment that meets regulatory standards. Operators receive thorough training to ensure the systems function properly and that emissions do not pose a threat to the surrounding environment.
The primary air pollutants generated by Nanya Technology include acidic, alkaline, and organic exhaust gases. Since trichloroethylene is not used as a raw material, no hazardous air pollutants (HAPs) are emitted. Based on the characteristics of each exhaust type, appropriate treatment processes and equipment are used. After being generated at the process level, emissions pass through local scrubbers to remove specific substances. Acidic and alkaline gases are routed to respective scrubbing towers before being discharged into the atmosphere. Organic exhaust is adsorbed by a zeolite rotor, concentrated, and then destroyed in afterburners, with combustion efficiency reaching 99%, well above regulatory standards. The overall VOCs (volatile organic compound) reduction rate is maintained at above 90% to meet regulatory requirements. In 2024, the VOCs emission intensity per unit of production capacity was 12.9 g VOCs/kpcs 4Gb eq.

Water Pollution Control
-
 Professional Treatment and Continuous Monitoring to Ensure Water Quality Standards
All wastewater at Nanya Technology is collected and categorized before being discharged to the appropriate treatment facilities. Every quarter, we commission a third-party organization to conduct monitoring surveys on the local ecology, hydrology, and air quality around the facilities. To ensure that effluent water quality falls within normal parameters and to address concerns among residents in the discharge basin, Nanya Technology has implemented a real-time effluent monitoring system that is directly connected to the Environmental Protection Department, enabling joint real-time monitoring to ensure effluent water quality remains normal.
-
 Strengthened Wastewater Management
We have remained committed to water pollution prevention, and continue to upgrade and invest in wastewater treatment facilities. 28 distinct pipelines are used to segregate and convey the different types of wastewater within the facility, In 2024, total wastewater discharge reached 2,864 million liters. Due to non-conforming handling of the membrane bioreactor (MBR) system during wastewater treatment, the volume of water reclaimed decreased, leading to an increase in wastewater discharge. As a result, total wastewater discharge in 2024 rose by 17.1% compared to 2023.


Explore the full story here
Download
 ESG News
 Facebook